Table of Contents
What is code visualization?
Benefits of code visualization
Popular code visualization tools
Improving code quality
Challenges of code visualization
How to visualize a codebase
Author: Gacoka Mbui
Date Published: November 6th, 2022
What is code visualization?
Code visualization is a process of representing code graphically by using various tools, such as UML diagrams, flowcharts, or property graphs. By visualizing code, you can better understand its structure and how it works. Additionally, code visualization can help to find errors and optimize code.
How can code visualization help developers?
As a developer, it is essential to understand code at a glance. Such a quick understanding can be difficult when working with large codebases or particularly complex code. Code visualization can help by providing a way to see the structure and the relationships between different parts of the code.
Several code visualization tools are available, each with strengths and weaknesses. Some tools focus on visualizing code structure, while others focus on showing the relationships between different parts of the code. Still, others allow you to interact with the code, making it easier to understand how it works. No matter which tool you use, code visualization can be a valuable addition to your toolkit.
What are some popular code visualization tools?
Call Graphs
Code2Flow is an open-source repository that visualizes the stack trace of a program before execution. According to Code2Flow's description, the program translates your source files into ASTs and finds all function definitions. The program determines where those functions are called for every execution step and connects the dots to display the call graph as a flowchart.
Visualizing call graphs helps untangle spaghetti code, find orphaned functions, and onboard new developers efficiently. Other call graphs include pycallgraph, pyan, PythonTutor, and RecursionVisualizer.
Docker Compose files
docker-compose-viz is a docker-compose file visualizer that aims to show interactions between docker volumes, dependencies, ports, extends, and networks. The program has three export modes: a PNG file of the graph visualization, a DOT renderer, and a display mode for the browser.
Files and directories
repo-visualizer, by GitHub Next, is a GitHub Action that creates an SVG diagram of your GitHub repository. It plots files as bubbles, indicating their extension names and sizes with colors and sizes, respectively.
Dependencies
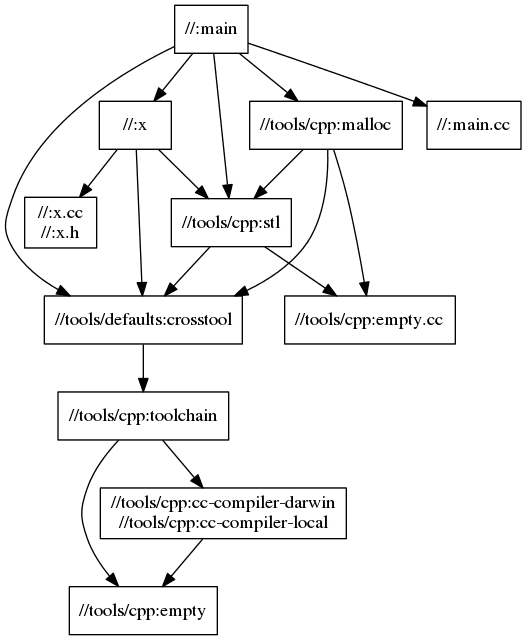
Bazel visualizes the code dependencies in an example build file.
Bazel is a language-agnostic build system that lets you see a graph of your build dependencies. It could help you debug things exported in DOT format and query dependencies from your build.
Other tools that achieve the same objective include pipdeptree and pydeps for Python and depgraph-maven-plugin for Java.
Free software that has all the features above:

CySuite displays a code property graph of a codebase.
CySuite is a modern debugging and analysis tool that represents source code as a knowledge graph, allowing for advanced query and visualization of source code. CySuite not only displays the call stack of a program as a log output but also as a beautiful knowledge graph that shows the dependencies between the code components.
Paid software that has all the features above:
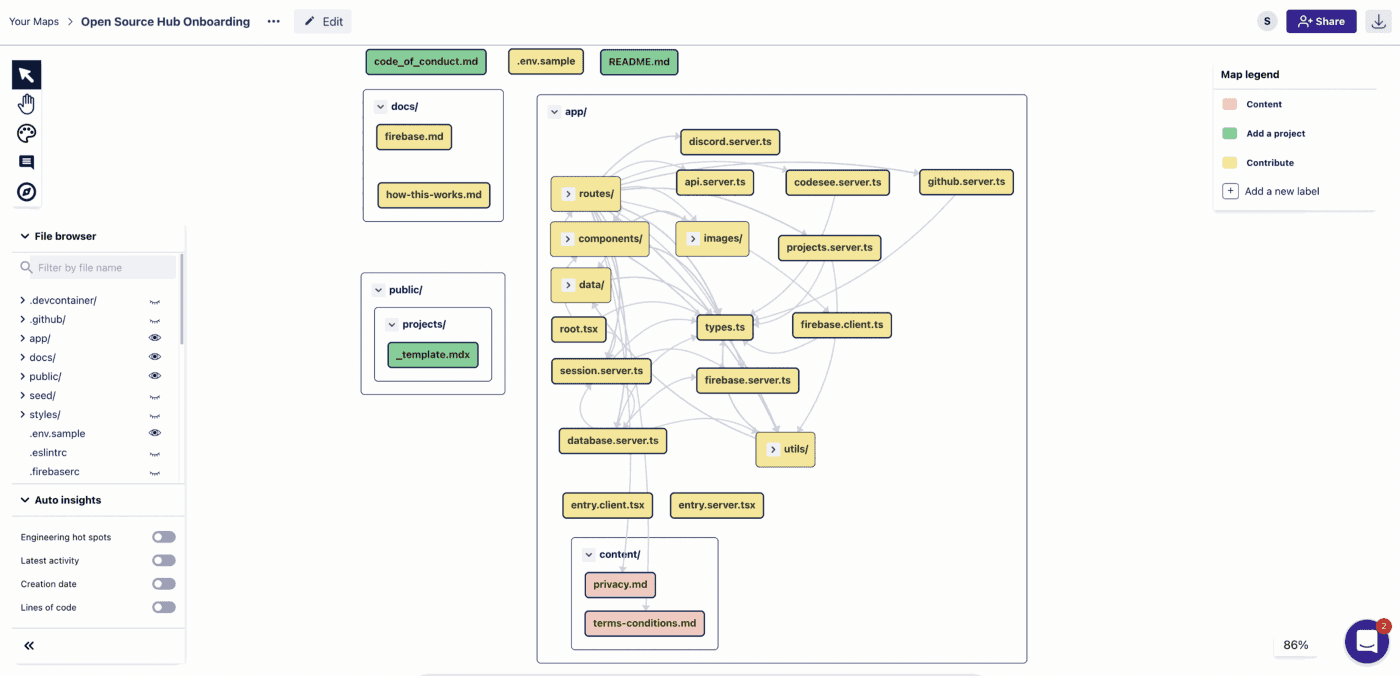
Codesee.io displays a graph representation of a codebase.
Codesee automatically creates a map of your code and sees the connection between your services, directories, and files. They offer flexible community to enterprise plans depending on your development team's unique needs.
How can code visualization be used to improve code quality?
Code visualization can take many forms, from displaying the networks in a docker-compose file to viewing the call graphs from a pre-compiled Python program. Property graphs can help you understand your code's overall structure and identify potential areas of improvement. Additionally, you can use code visualization to generate a flowchart of your code which can help you understand the order in which your code is executed and identify potential errors.
Challenges associated with code visualization
One of the challenges associated with code visualization is that it can be difficult to represent code in a way that is both accurate and understandable. For example, when visualizing code, it is vital to show the relationships between different pieces of code. Still, it can be challenging to do so in a way that is easy for people to understand. Additionally, developers can use code visualization to show the code results, but it can be challenging to ascertain the intermediate steps that lead to the final result.
Read More: A New Debugging Framework for the Visual Age: How to improve your debugging process